Life Cycle Analysis of hydrogen compression
Published on 23 January 2022
Compressing hydrogen for storage or use within a vehicle is mandatory because of the huge volume that would be required to store it at ambient pressure. For example, a 40L tank filled at 700 bar can store 1.5 kg of hydrogen (the energetic equivalent of 6L of gasoline), while 19,380L would be required at ambient pressure to store the same mass.
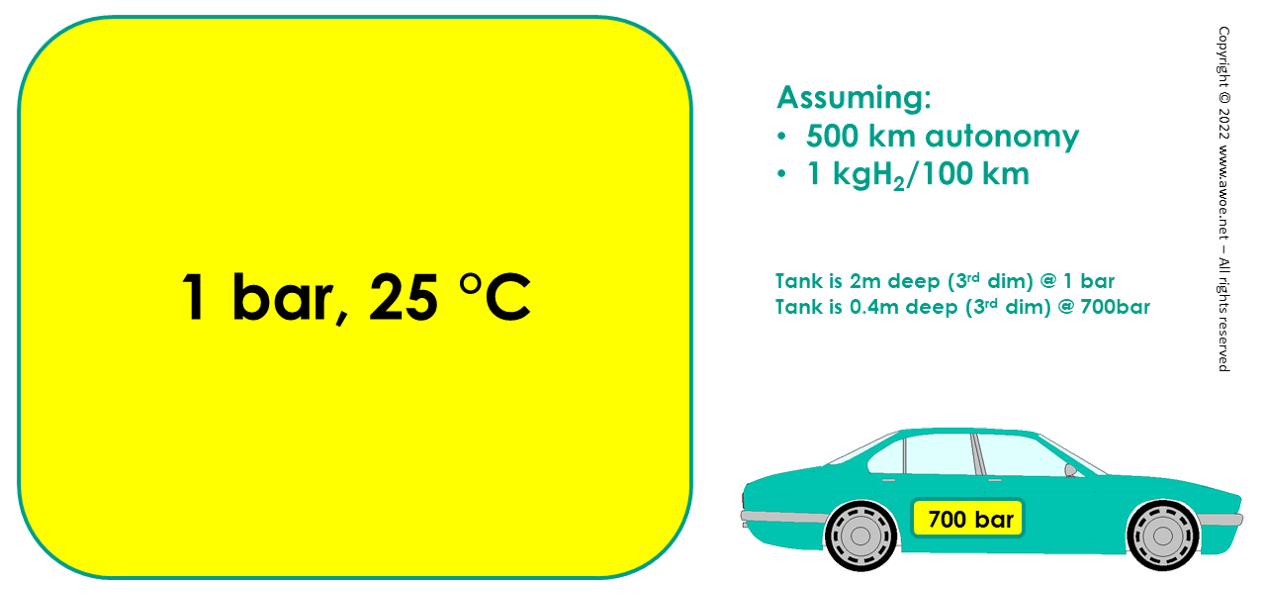
Schematic of space claim for storage of 5 kg of hydrogen (500 km autonomy) at various pressures
Mature hydrogen compression technology is today a matter of mechanical compression (see all existing technologies). More precisely, the most widespread technologies for high-pressure compression for storage and dispensing purposes are reciprocating piston compressors, diaphragm compressors and ionic compressors. Centrifugal compressors are widely used for pipelines but this is out of the scope of present analysis because they cannot achieve the pressure level required for storage.
Efficiency and energy consumption for H2 compression
Like for any compression process, compressor efficiency is central to operational costs and environmental impact of hydrogen compression. Yet, the relative influence is larger for hydrogen because its properties (mainly its very low density) call for a compression at higher pressure and a larger energy consumption to reach such pressures. As a reminder, an isothermal compression of hydrogen from ambient pressure to 1000 bar requires 2.64 kWh/kg, while the same compression for air only requires 0.19 kWh/kg.
Such a huge energy consumption highlights the importance of any gain in efficiency during compression to keep the green hydrogen route on the path of clean technologies. Collection of efficiency of various commercially available units for hydrogen compression, included piston compressors, diaphragm compressors and ionic compressors highlights the general trends. The efficiency appears to be largely dependent on the required flow rate: while an isothermal efficiency around 60% can be achieved at low flow rate, an isothermal efficiency of 40% is observed on very large units delivering both very high pressure and very large flow rates.
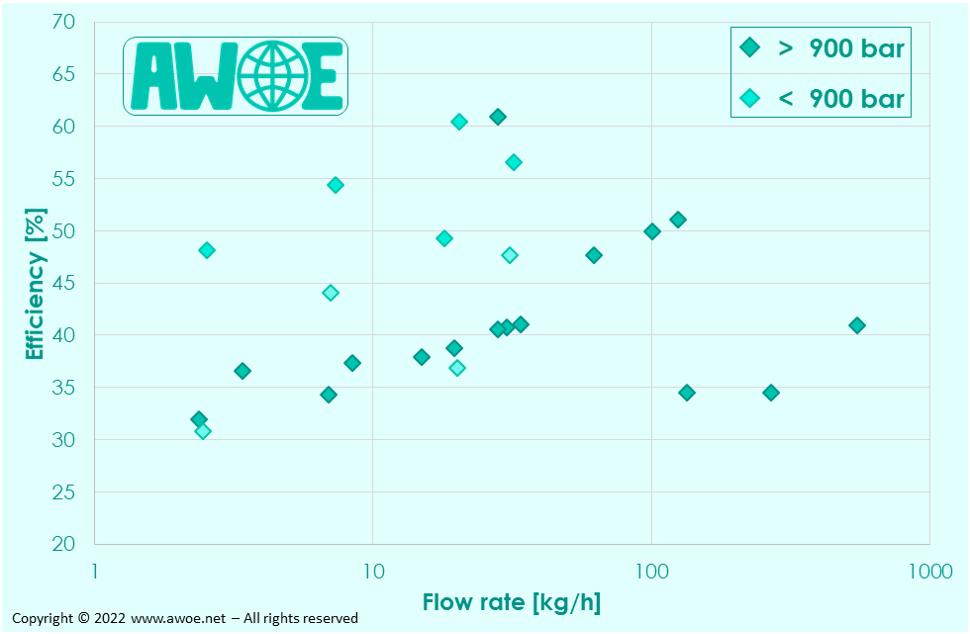
Hydrogen compressor efficiency as a function of delivery pressure and flow rate
Integrating the range of achievable efficiency, the effective energy consumption for hydrogen compression from ambient to 900 bar (for storage at 700 bar) lies between 4.31 and 6.46 kWh/kg. However, hydrogen is generally produced between 10 and 30 bar within an electrolyser , 15 bar being the most frequent, while compression from ambient to 15bar is a significant portion of the path towards 900 bar. Therefore, the relevant energy consumption to reach 900 bar for hydrogen coming from an electrolyser supply at 15 bar is lower and ranges from 2.68 to 4.03 kWh/kg.
Carbon footprint from manufacturing and installation
Compressors capable of delivering 1000 bar at industrial flow rates are big units with extensive use of high-grade steel. Beyond the compressor itself, the installation also includes a containing structure as well as a concrete foundation.
Based on manufacturers data, GREET data for materials and some literature data on energy consumption during manufacturing, it is possible to estimate the greenhouse gas emissions for building the compression unit. Note that manufacturing energy consumption is a significant portion of the final result. Accordingly, the related greenhouse gas emissions are computed taking into account the range of electricity carbon footprint within the country of manufacture (using national statistics of electricity production in 2020), thereby defining a range of equivalent emissions as the exact timing of manufacturing within the year would influence actual emissions.
To convert total equivalent emissions of CO2 into specific emissions (gCO2,eq/kgH2), we assumed that the compressor is operating 8000 h/y (which is totally possible based on compressors' maintenance requirements) for 20 years. The life duration of such compressors is generally longer than 20 years, but this is the standard duration for the life cycle analysis of both the electrolyser providing the hydrogen and the wind turbines powering the electrolyser and the compressor.
For compressors with enough publicly-accessible information (pressure capability, structure, materials, packaging), it is possible to estimate the specific equivalent emissions from manufacturing and installation. The emissions tend to decrease with the size of the compressor simply because the amount of produced hydrogen progresses a lot (X-axis is logarithmic here) and the relative influence of the containing structure and foundations diminishes. A value of about 5 gCO2,eq/kgH2 is possible when manufacturing uses relatively clean electricity (100 gCO2,eq/kWh or less) but main manufacturers are located in countries that occasionally produce very dirty electricity, leading to a large increase in equivalent emissions.
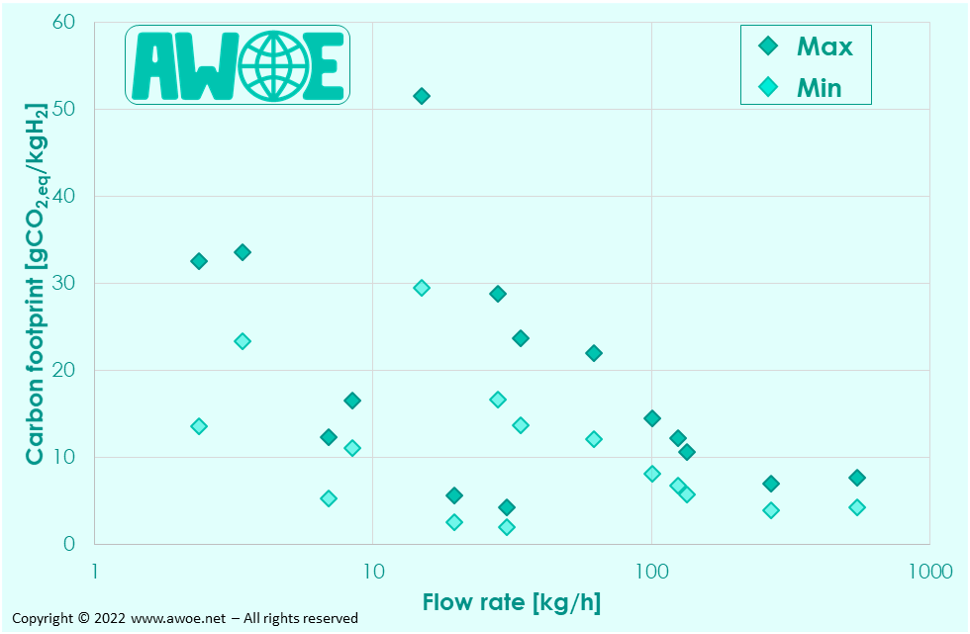
Carbon footprint of various hydrogen compressors - Manufacturing and installation only
Carbon footprint from operation
For the selected compressors, the specific energy consumption being known, it is possible to estimate the carbon footprint during operation. For this purpose, we assumed that wind turbines are the exclusive source of electricity not only to produce green hydrogen in the electrolyser but also to compress it for storage purposes.
As shown by a Life Cycle Analysis of wind turbines, the equivalent greenhouse gas emissions of their electricity production lie between 7 and 38 gCO2,eq/kWh depending on wind turbine type and location. As green electricity will never be sold with a differentiation between type of turbines, we computed a range of equivalent emissions based on the extreme carbon footprints.
When only considering operation, the equivalent emissions for compression are driven by electricity cleanliness. There is obviously a factor of about 5 between worst and best conditions, simply based on how clean the electricity is. This appears to be more important than the compressor design and its efficiency which only implies at most a factor of 2 between units.
Carbon footprint of various hydrogen compressors - Operation only (Electricity from wind turbines only)
Total environmental impact of hydrogen compression for storage or dispensing
The computed equivalent emissions for compressor installation and operation can be combined to obtain the total emissions (literature review confirms that disposal only has a marginal effect on final result). Clearly, because of the specific properties of hydrogen, operation has a significantly larger impact than installation (ratio of 6 to 1).
The total equivalent emissions for hydrogen compression are therefore mainly driven by:
- At a first order, the equivalent emissions of electricity used to power the compressor
- At a second order, the size of the compressor with bigger units leading to lower emissions per kg of H2 produced over 20 years

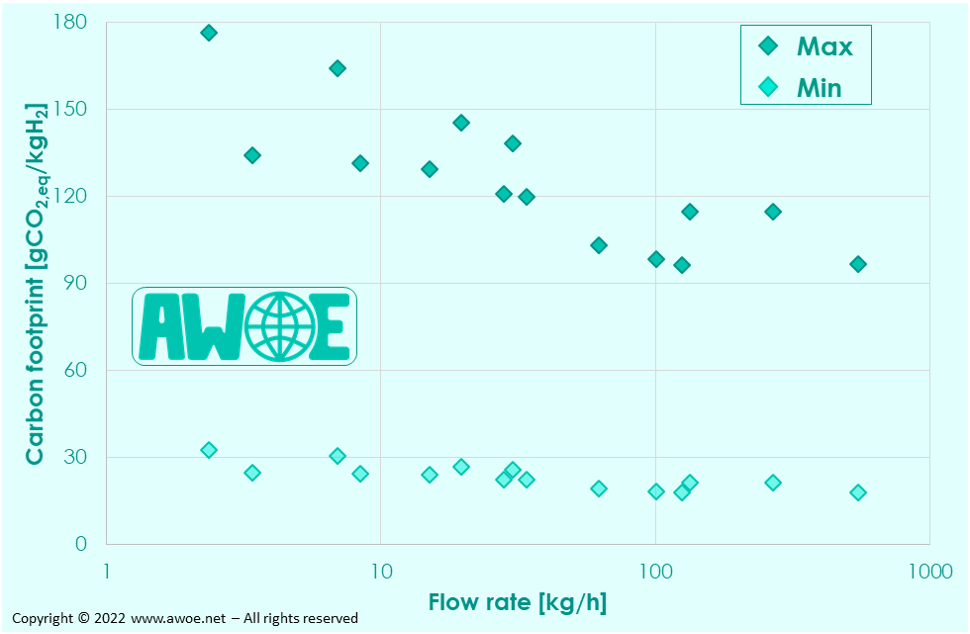
Total carbon footprint of various hydrogen compressors (Electricity from wind turbines only)
A key result of this analysis is that compression of hydrogen for storage purposes only has a secondary effect on green hydrogen equivalent greenhouse gas emissions compared to water electrolysis. Predicted specific emissions can be as low as 20 gCO2,eq/kgH2 but can grow up to 200 gCO2,eq/kgH2 (assuming year-long compressor operation), which favourably compares to literature data considering an actual small compression unit[1].
References
[1] Burkhart et al., Hydrogen mobility from wind energy – A life cycle assessment focusing on the fuel supply, Applied Energy, 181 (2016), 54-64